
- All Posts
- Uncategorized
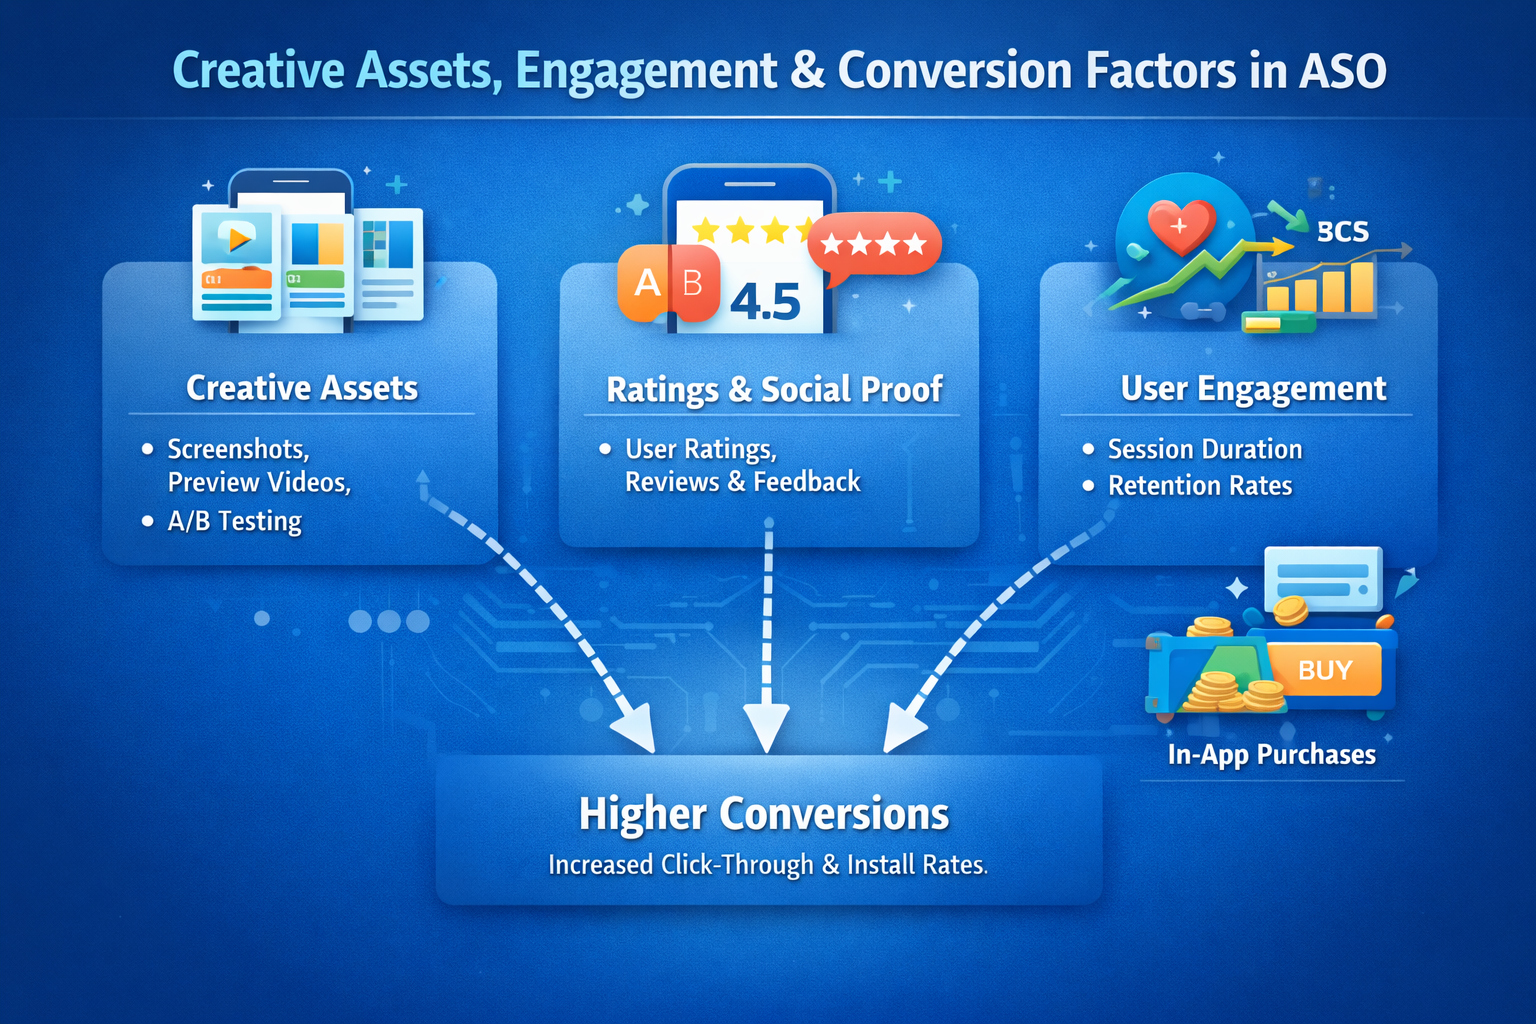
Introduction Discovery is only the first step. In 2026, converting visibility into installs and retention requires strong creative assets, high-quality…
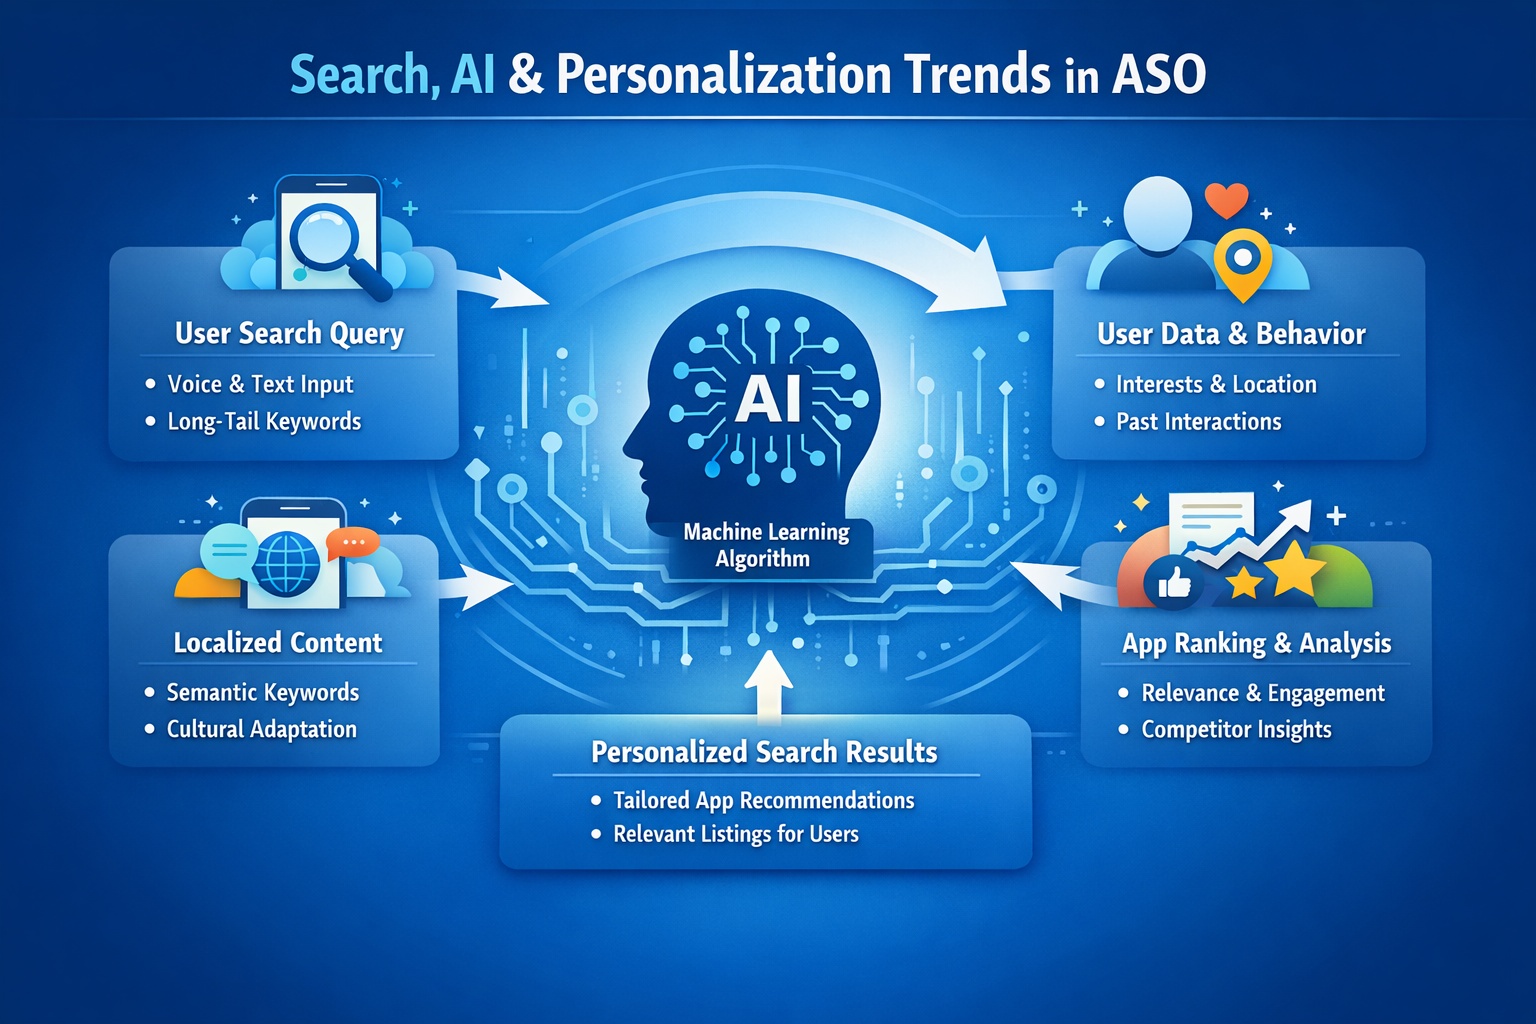
Introduction In 2026, App Store Optimization (ASO) has become far more than keywords. With the rise of AI and personalized…
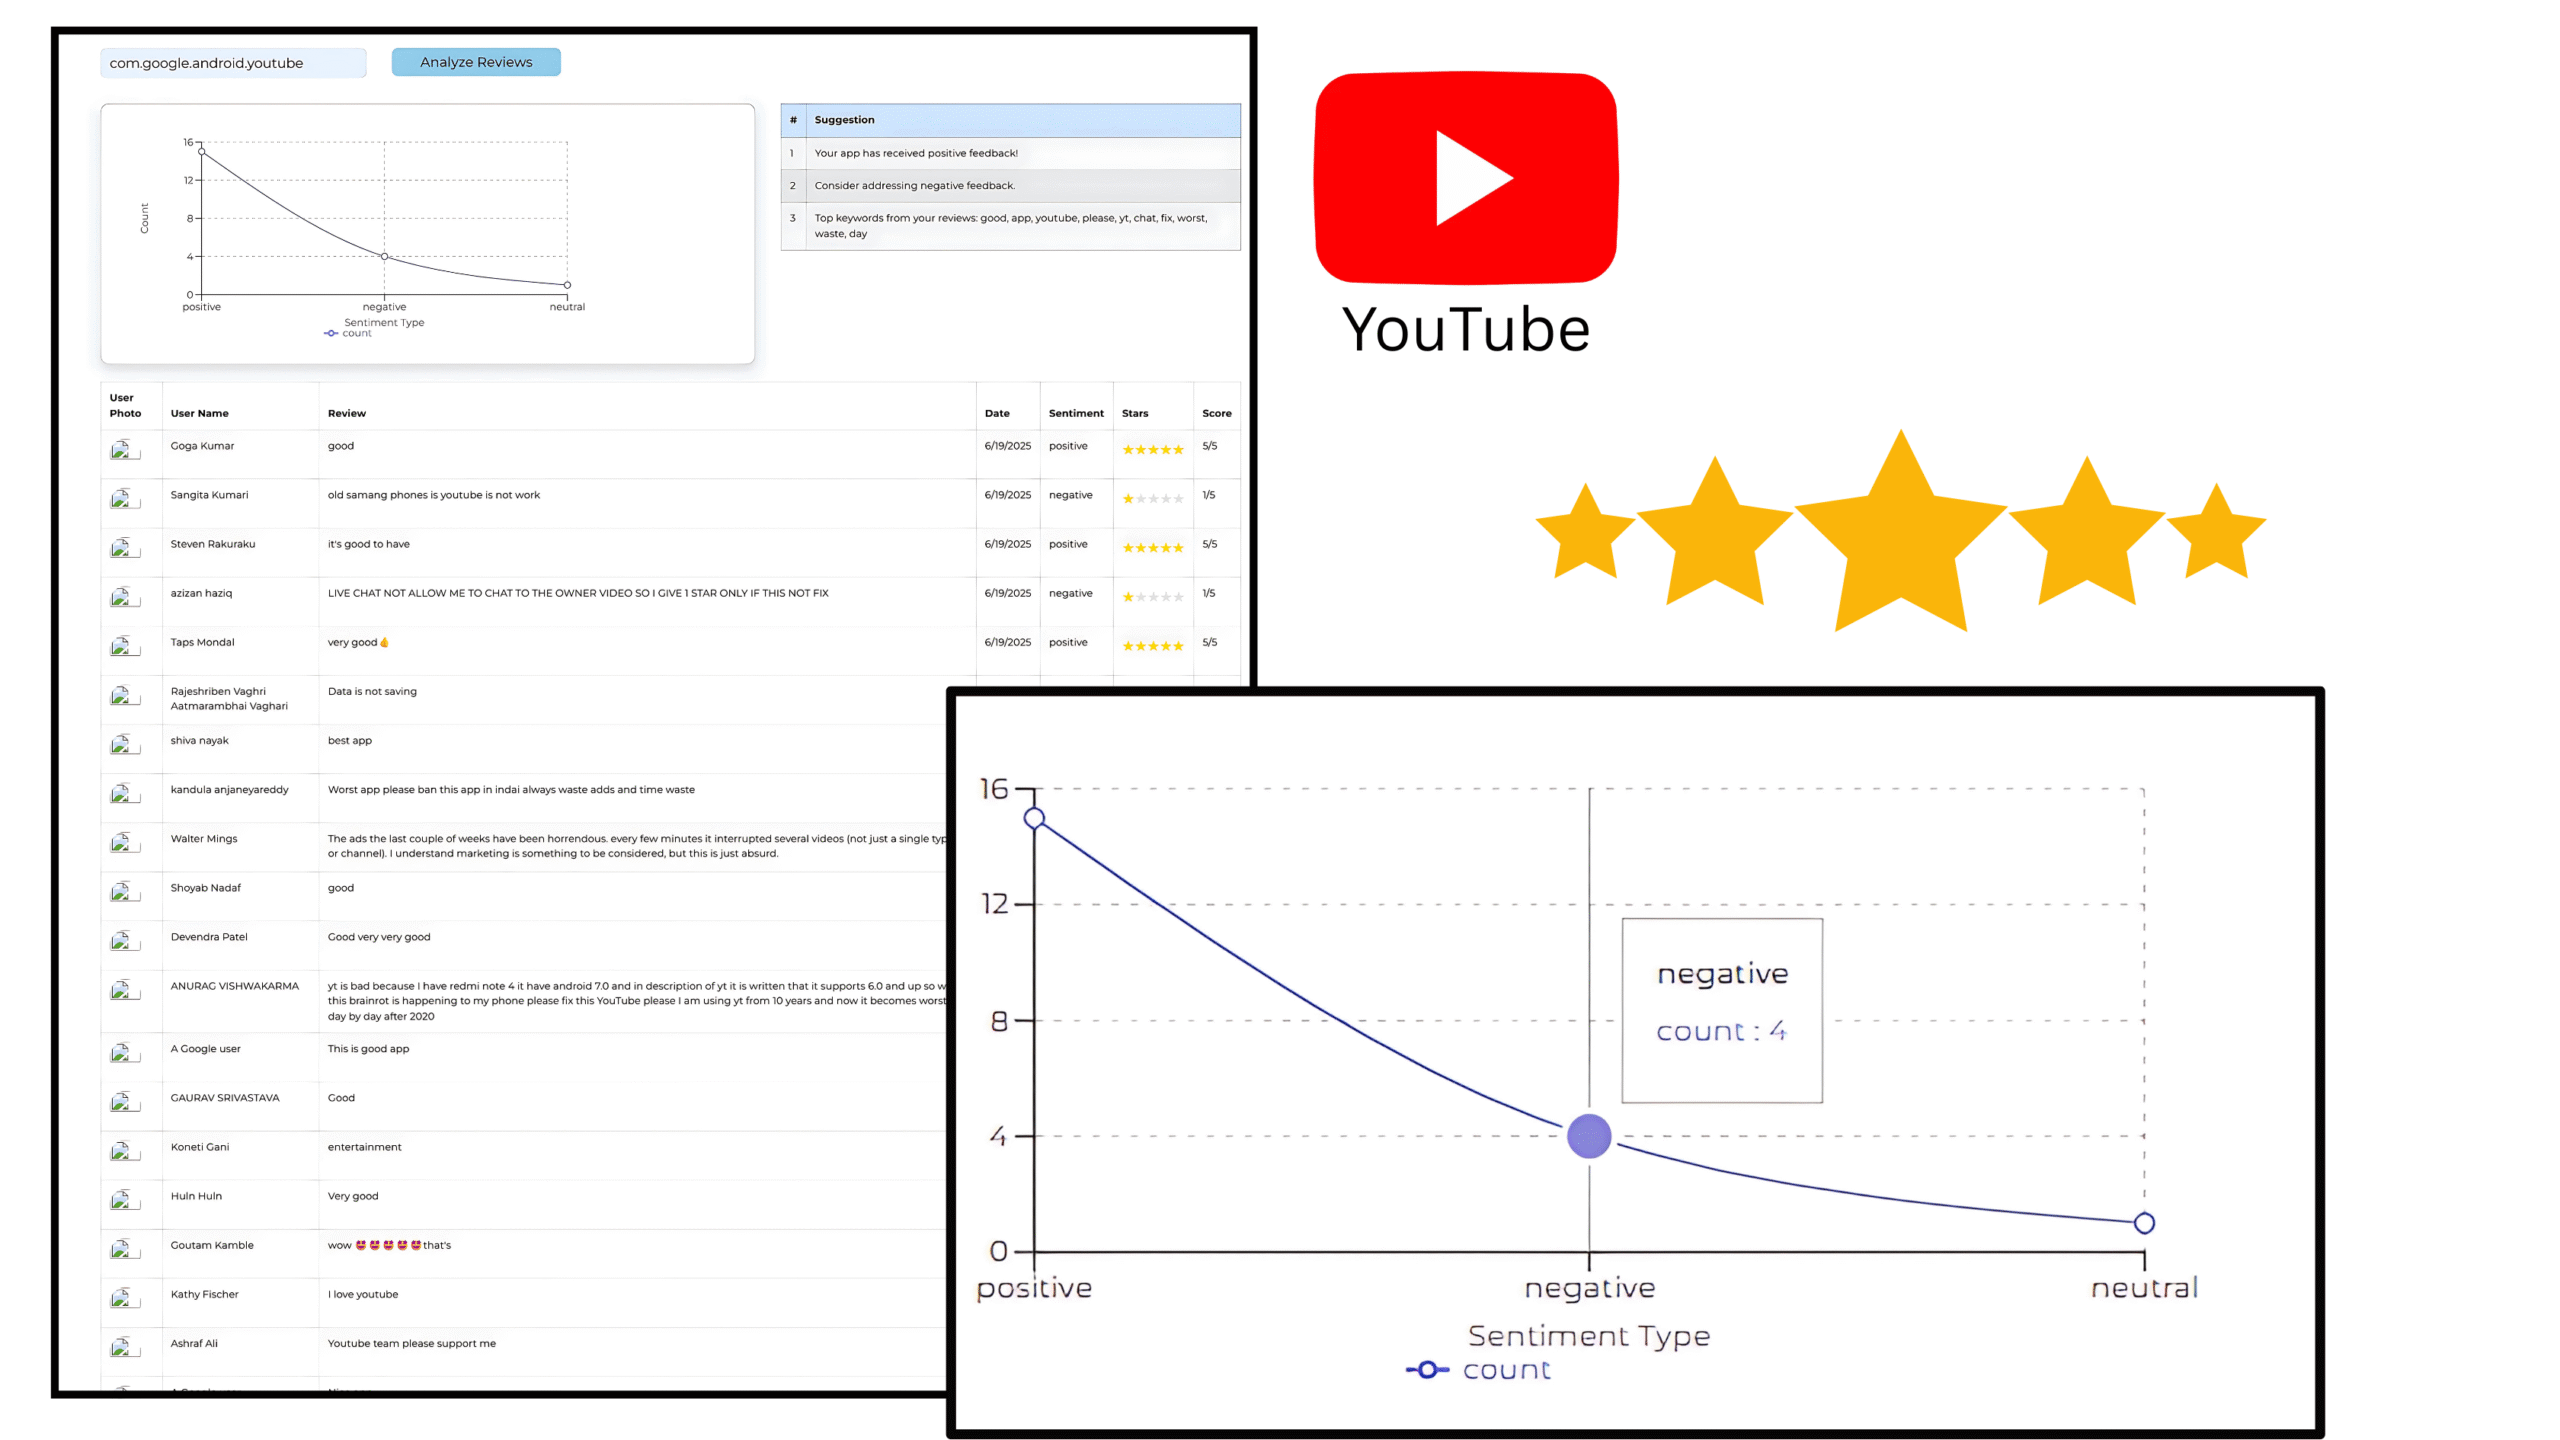
The Secret Link Between Ratings, Reviews & ASO Performance Discover how ratings and reviews influence ASO visibility, conversions, and growth.…
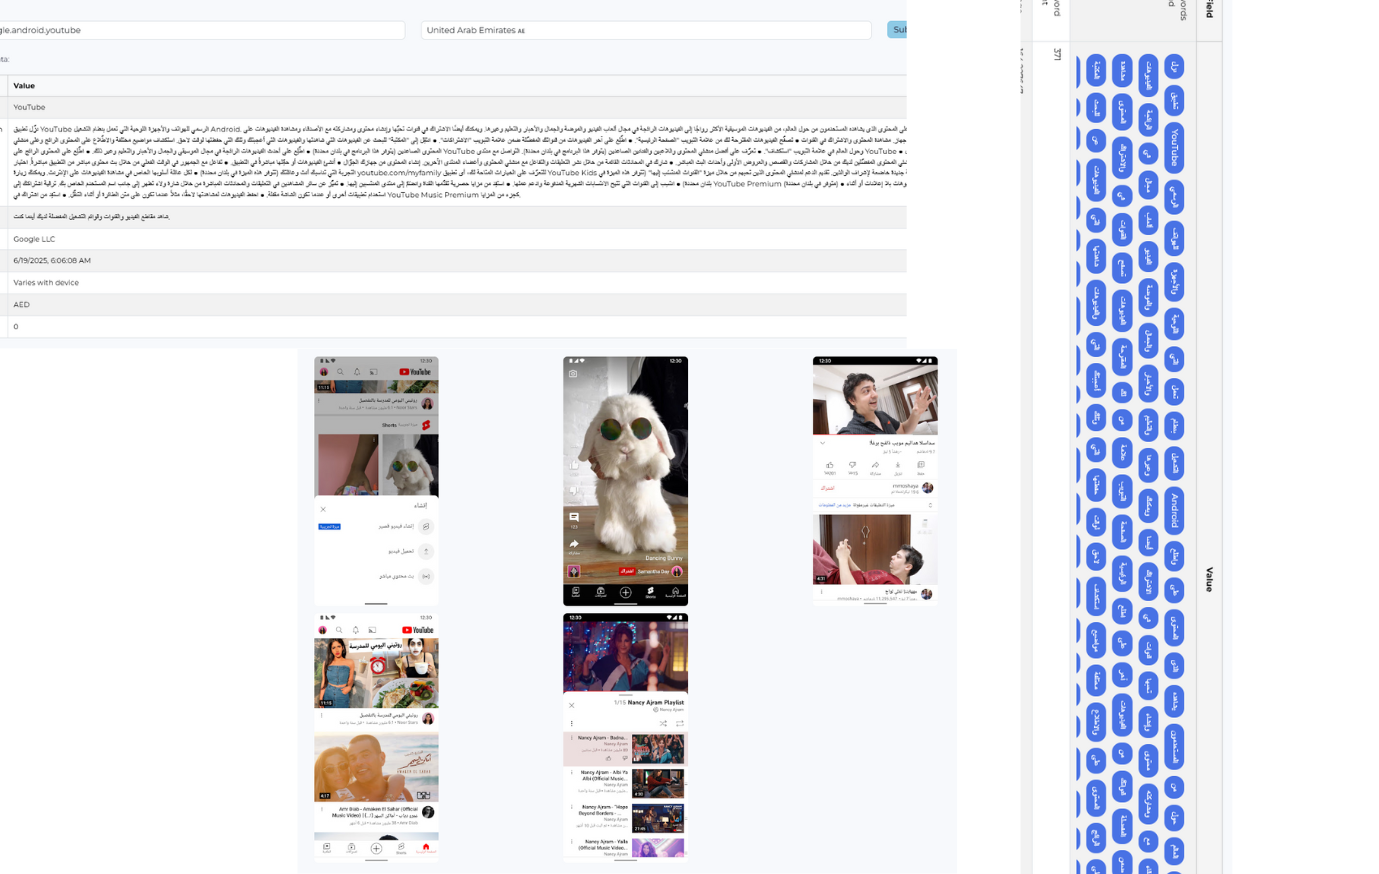
Boost your app’s global reach with ASO localization. Learn how to adapt keywords, visuals, and content for international users using…

App Store Optimization Tips for Conversions Learn how to turn app store visitors into loyal users with CRO in ASO.…
Boost App Visibility with Keywords & ASO | App Optimax Learn how App Optimax boosts app visibility with keyword research,…

How ASO Evolved into a Complete App Growth Strategy | App Optimax Discover how ASO evolved from basic keyword tweaks…